Loki
Prerequisite
- Kubernetes cluster
- Helm
Install & Uninstall
https://grafana.com/docs/loki/latest/installation/helm/
-
Deploy Loki Stack (Loki, Promtail, Grafana, Prometheus) via Helm.
helm repo add grafana https://grafana.github.io/helm-charts
helm repo update
helm upgrade --install loki grafana/loki-stack --set grafana.enabled=true,prometheus.enabled=true,prometheus.alertmanager.persistentVolume.enabled=false,prometheus.server.persistentVolume.enabled=falsePods
kubectl get po NAME READY STATUS RESTARTS AGE loki-0 1/1 Running 0 98s loki-grafana-7666b484b5-s6dkk 1/1 Running 0 2m19s loki-kube-state-metrics-7f9f667d7d-9wqgr 1/1 Running 0 2m19s loki-prometheus-alertmanager-9bb4c6f8f-gc6jb 2/2 Running 0 2m19s loki-prometheus-node-exporter-ngq8l 1/1 Running 0 2m19s loki-prometheus-pushgateway-664fd45795-cffhg 1/1 Running 0 2m19s loki-prometheus-server-5d6f9d5c6c-sn699 2/2 Running 0 2m19s loki-promtail-bztwq 1/1 Running 0 2m19s -
Uninstall
helm uninstall loki
Promtail
Promtail is configured in a YAML file (usually referred to as config.yaml) which contains information on the Promtail server, where positions are stored, and how to scrape logs from files. (For more details: Configuring Promtail)
Note that while Promtail can utilize the Kubernetes API to discover pods as targets, it can only read log files from pods that are running on the same node as the one Promtail is running on. Promtail looks for a host label on each target and validates that it is set to the same hostname as Promtail’s (using either $HOSTNAME or the hostname reported by the kernel if the environment variable is not set).
Default scrape_configs:
- kubernetes-pods-name
- kubernetes-pods-app
- kubernetes-pods-direct-controllers
- kubernetes-pods-indirect-controller
- kubernetes-pods-static
Grafana
Connect to grafana
-
Port forward
1. Get the initial password forkubectl port-forward svc/loki-grafana 3000:80admin.1. Open http://localhost:3000kubectl get secret loki-grafana -o jsonpath="{.data.admin-password}" | base64 --decode ; echo
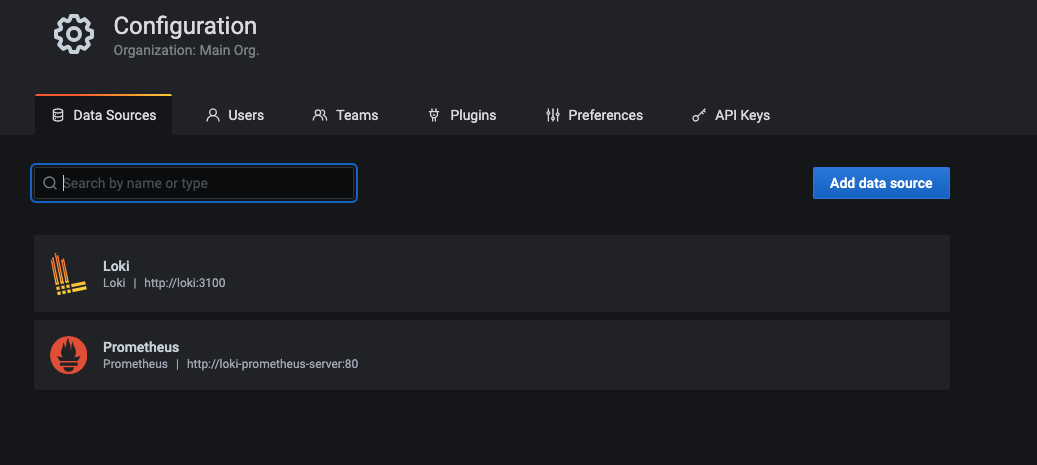
Data source for Loki on Grafana
https://grafana.com/docs/loki/latest/getting-started/grafana/
By default, data sources for Loki and Prometheus are set in http://localhost:3000/datasources.
details
Dashboard
sample-app
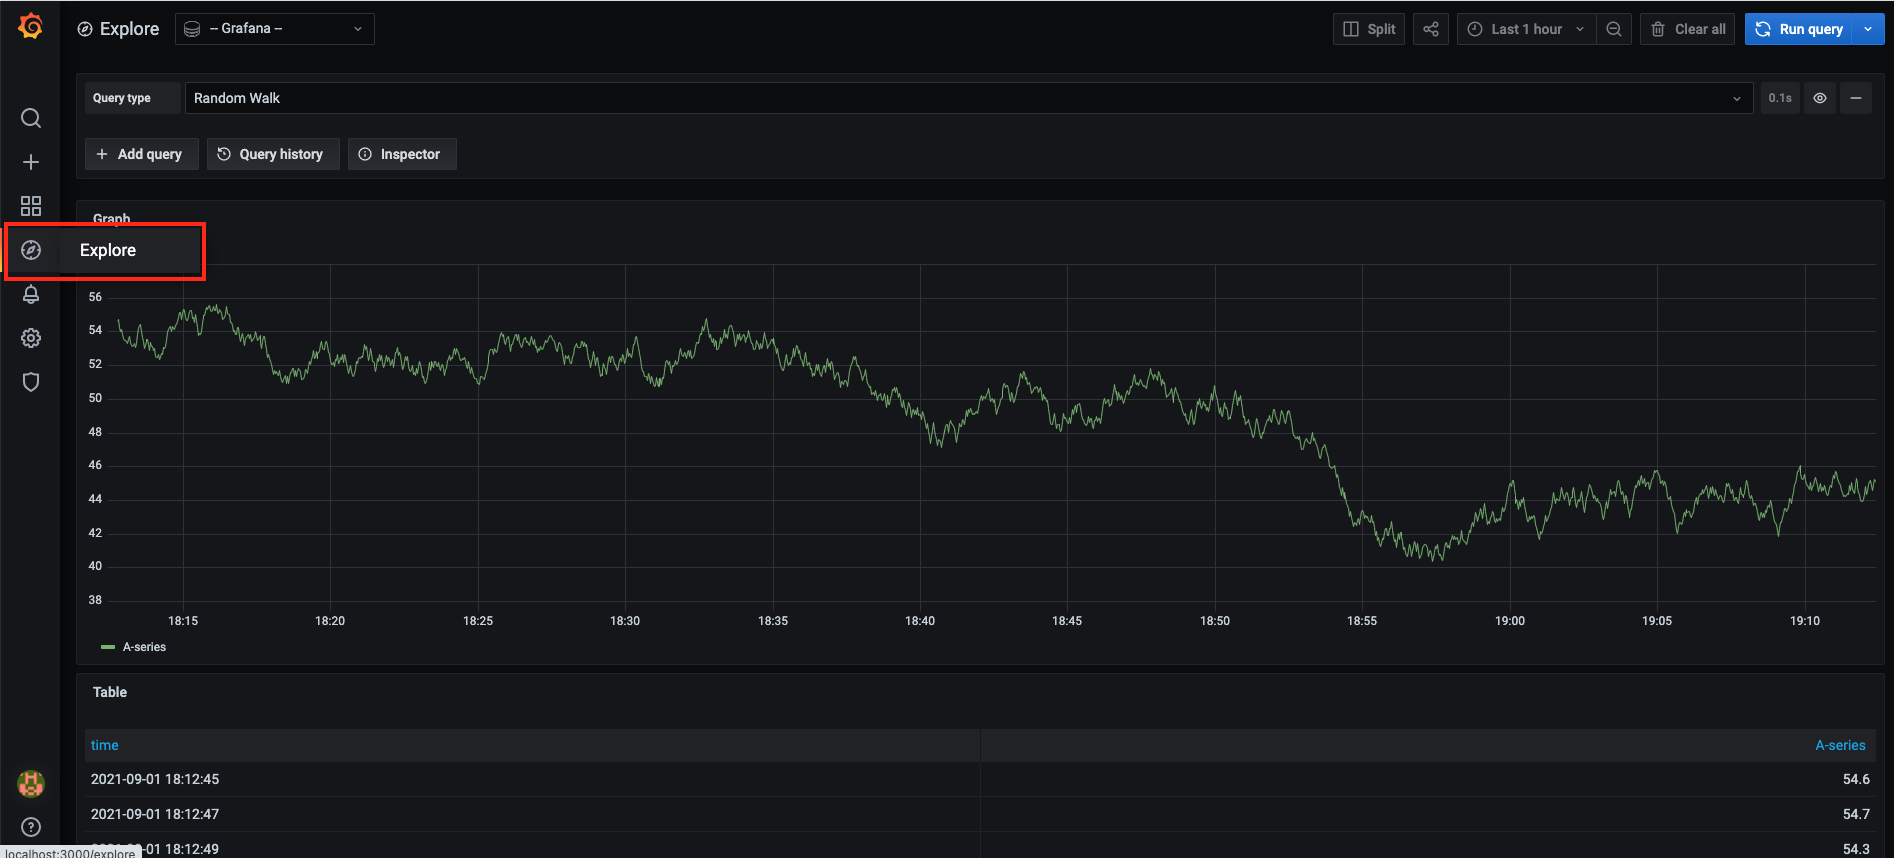
1. Applied sample app in [Deploy Simple Application in Kubernetes](https://github.com/nakamasato/kubernetes-basics/tree/v2.0-rc/06-run-simple-application-in-kubernetes) 1. Check on `Loki Dashboard quick search` 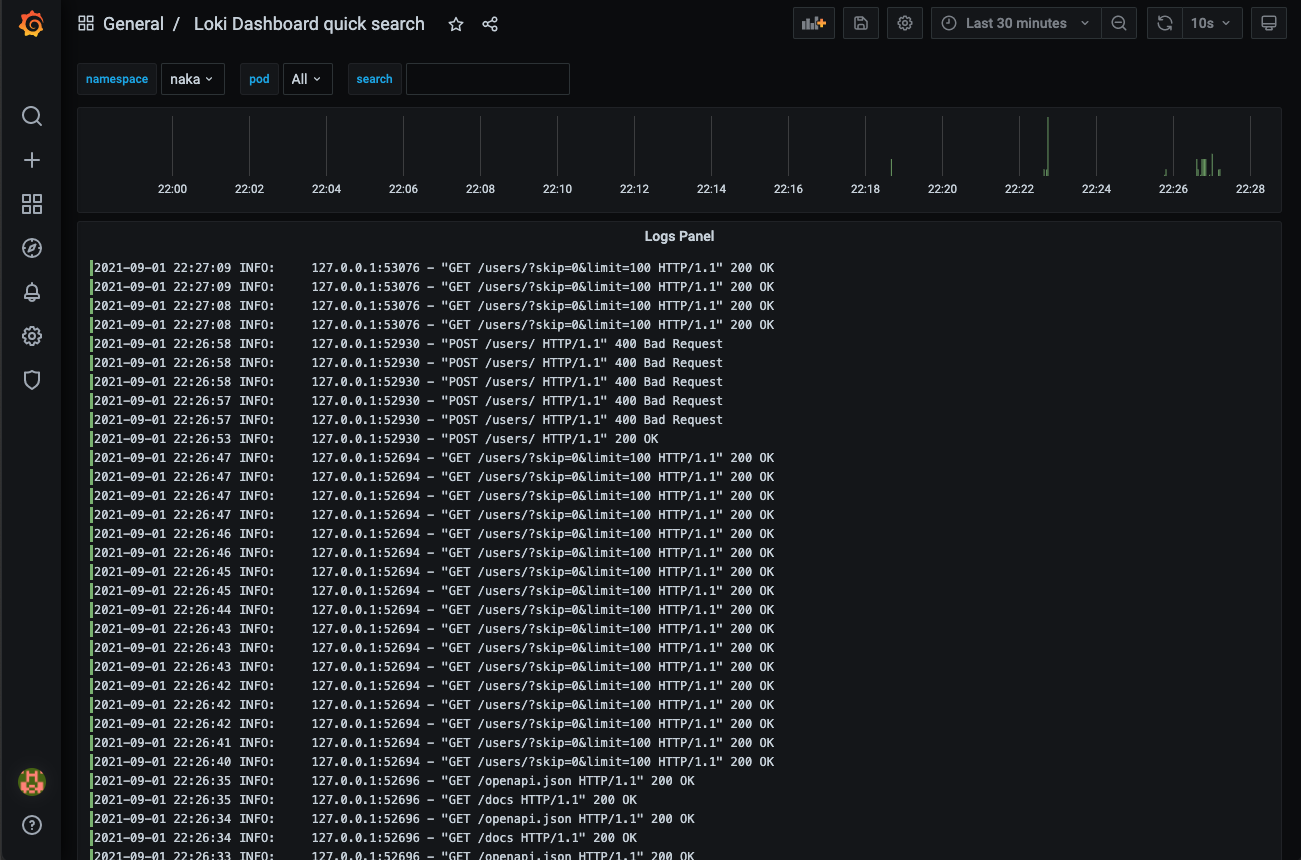 You can see `sample-app`'s logs in the dashboard, but you cannot see the logs if you choose the pod. (I don't know why.) 1. Check on `Logging Dashboard via Loki` 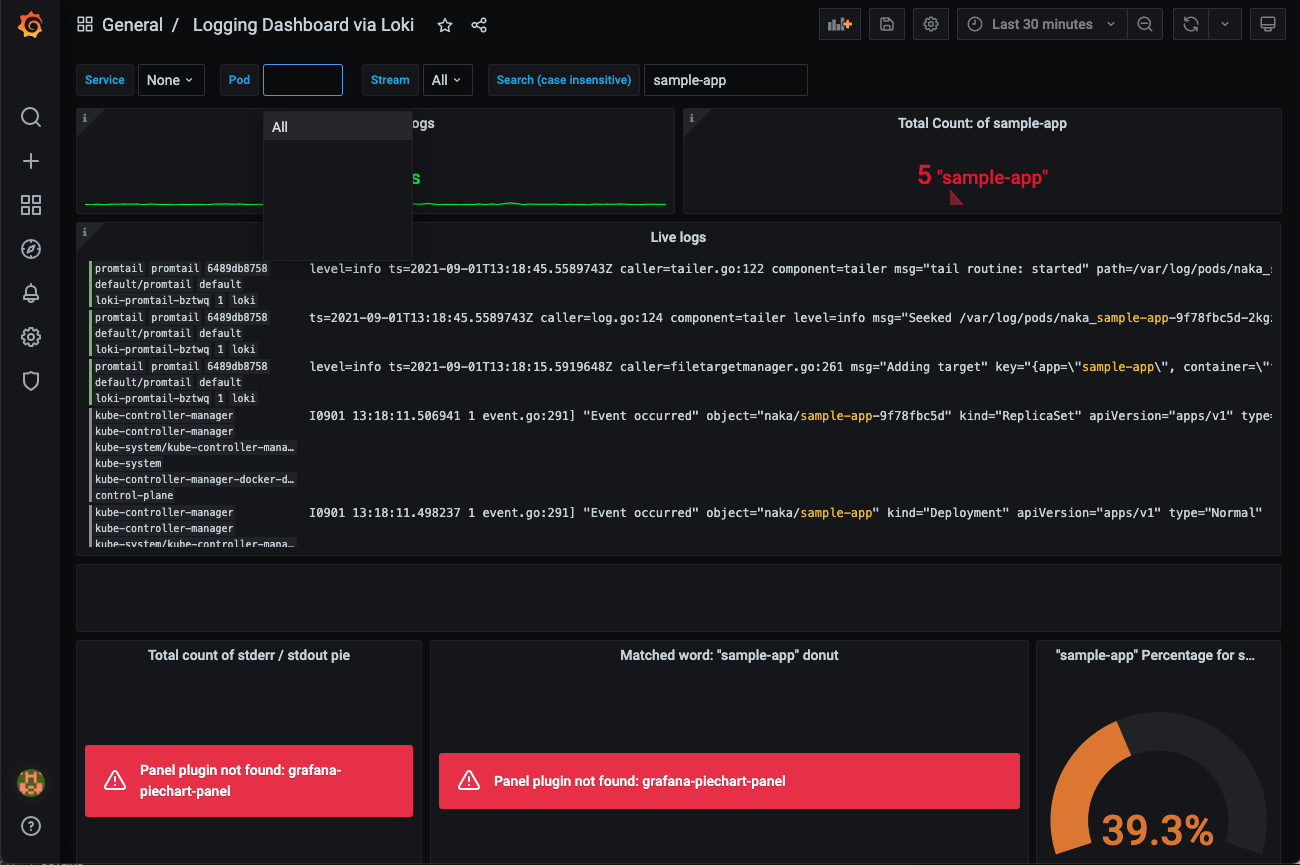 - You cannot see `sample-app`'s log and Pod list. - Panel plugin is required to display piecharts.Explore
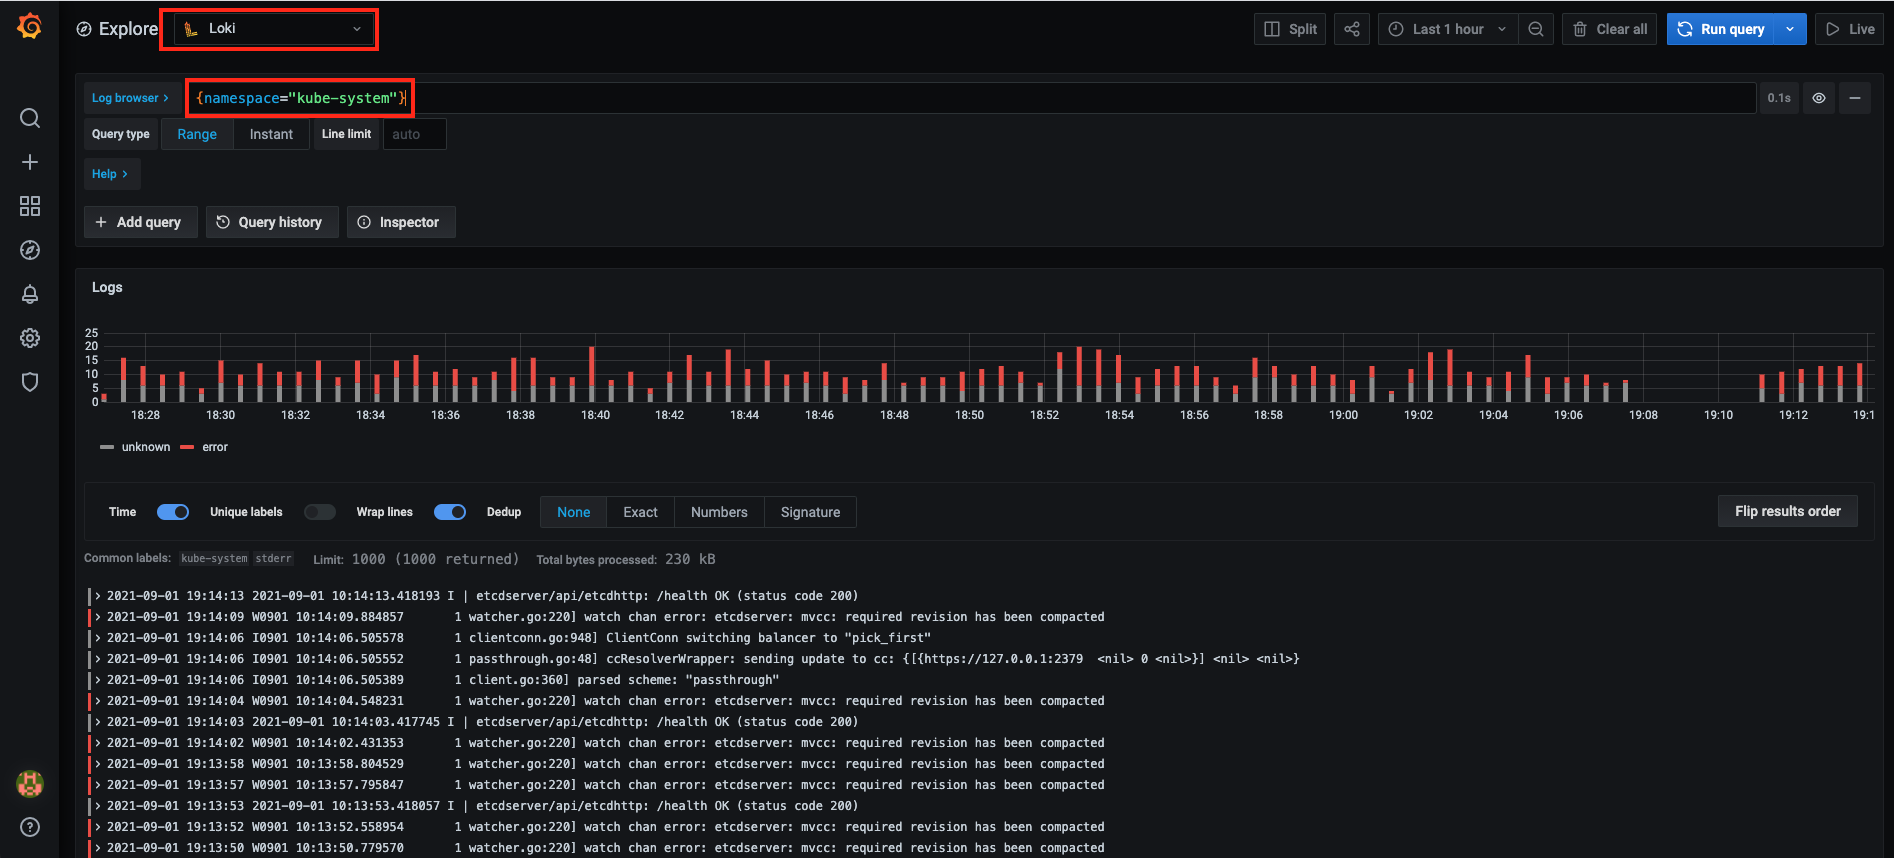
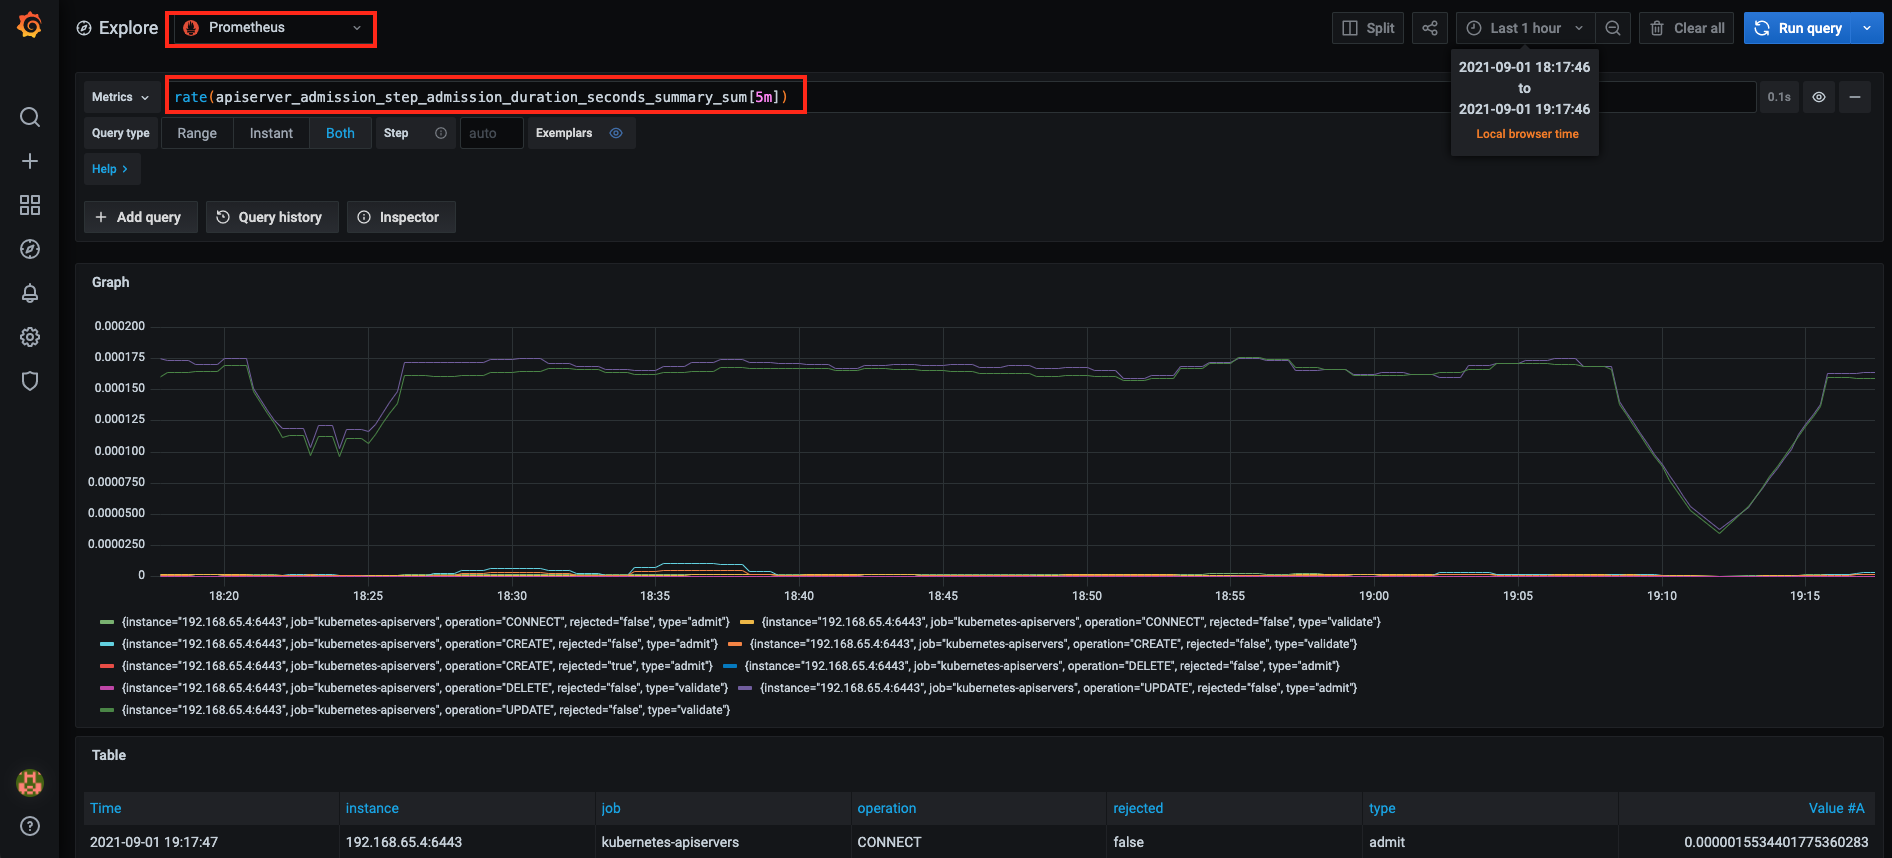
Log CLI
https://grafana.com/docs/loki/latest/getting-started/logcli/
go get github.com/grafana/loki/cmd/logcli